

Building Effective Reports: How the MAD Framework Enhances Data Analysis
The development of a report begins with thorough requirement gathering and understanding of the end-users needs. This foundational step ensures that the final product will be relevant and useful. To structure the approach, the MAD framework—Monitor-Analyze-Detail—is often relied upon. This hierarchical analysis framework offers an interactive structure that delivers information on demand, optimizing adoption and usability.
Requirement Gathering
Before diving into the MAD framework, engaging in comprehensive requirement-gathering sessions is essential. Broadly, this involves:
- Identifying Stakeholders: Understanding who will use the report and their specific needs.
- Defining Objectives: Clarify the report’s goals and the most important key performance indicators (KPIs).
- Data Sources: Determining where the data will come from and ensuring its accuracy and reliability.
- Technical Requirements: Understanding any technical constraints or requirements for the reporting tool.
This step ensures that the report is tailored to the specific needs of the business and sets a solid foundation for the design process. It is important to note that this is not an exhaustive list of steps but rather a high-level outline to guide the initial phases of report development.
Educating Stakeholders and Managing Scope
Educating stakeholders on the MAD framework is crucial for maintaining the scope and ensuring the development process stays on track. This education helps in:
- Understanding the Framework: Explaining how Monitor, Analyze, and Detail levels work together to provide comprehensive insights.
- Setting Expectations: Clarifying what the final report will deliver and how it will meet their needs.
- Preventing Scope Creep: Ensure the focus is on the MVP (Minimum Viable Product) and avoid unnecessary additions that could delay the project or increase costs.
By ensuring stakeholders are well-informed about the framework, it becomes easier to manage their expectations and maintain a clear focus on delivering a viable product within the agreed time and budget.
Incorporating Brand and Marketing Elements
As part of the design process, it is essential to ask for any brand or marketing information, PowerPoint presentations, websites, etc., that can help in designing the best report for your client. These elements ensure the report aligns with the client’s branding and communication strategies, enhancing its visual appeal and usability.
The MAD Design – Monitor, Analyze, and Detail
The MAD framework is a hierarchical analysis tool that enhances user adoption and usability through its interactive design, delivering information on demand.
The pyramid-shaped framework symbolizes the expansion of user dimensions, measures, and trends at each level. As users move through each layer, they gain additional insights, perspectives, and details that help them better understand problems and identify the necessary steps to address them.
Designed for flexibility, the MAD framework allows for the quick and easy creation of custom reports from adaptable dashboards tailored to individual user needs. This feature is crucial for fostering a self-reliant business intelligence (BI) ecosystem, enabling business users to delve deeper into data without increased dependence on IT teams.
By promoting a culture of measurement and data-driven decision-making, the MAD framework helps minimize organizational silos and ensures that decisions are based on facts and organizational silos are minimized.
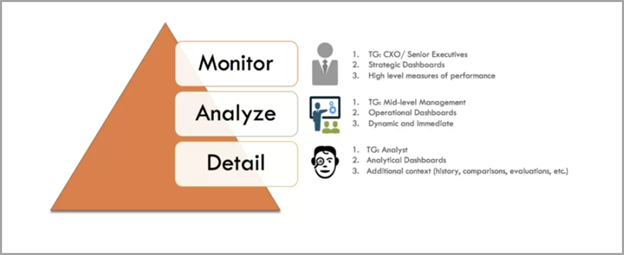
Monitor
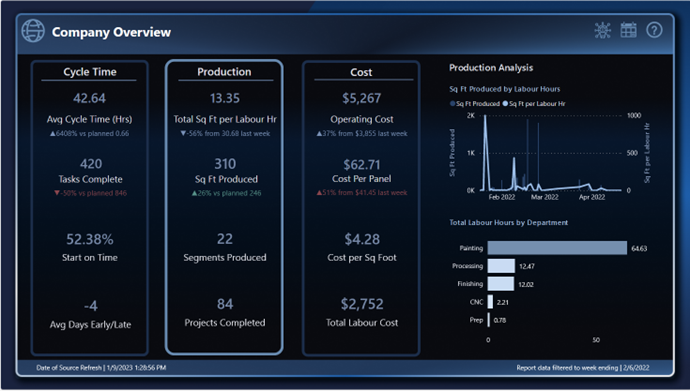
The Monitor level provides a summarized overview of the data, allowing business users to assess the status and trend of KPIs at a glance. This level is akin to the dashboard in a car, which provides the key pieces of information needed to monitor the vehicle’s consistent running. Similarly, a business dashboard should quickly convey the organization’s status at a high level, typically featuring a few KPIs and charts.
Key characteristics of the Monitor level include:
- Summarized Data: High-level KPIs and trends.
- Visual Clarity: Simple, intuitive charts and graphs.
- Quick Insights: Immediate understanding of performance.
Analyze
The Analyze level allows users to explore the KPIs from multiple perspectives or dimensions in more detail. Each business area might have its own sheet within the reportat this stage, allowing for deeper analysis. The goal here is to provide tools for selecting and filtering different dimensions, enabling users to drill down and ask more specific questions.
Key characteristics of the Analyze level include:
- Detailed Analysis: Multiple charts and visualizations.
- Interactivity: Tools for filtering and selecting data dimensions.
- Focused Insights: A deeper understanding of specific areas.

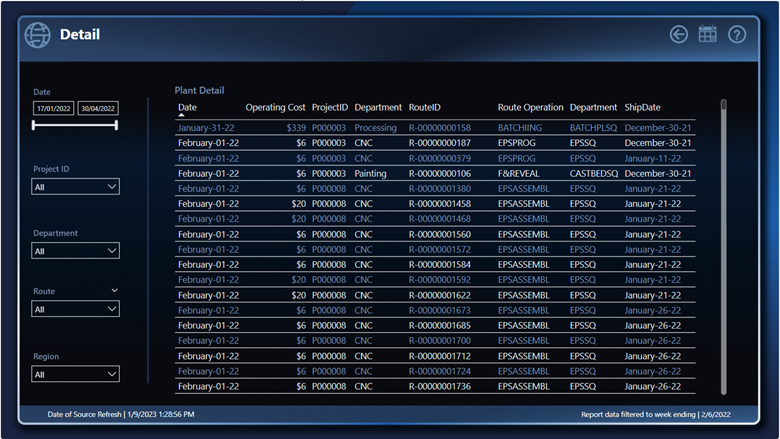
Detail
Once a possible issue has been identified, the Detail level provides further detailed data. For example, if a specific category is underperforming, this stage allows users to view all the relevant details to understand the root cause. This detailed analysis is crucial for actionable insights and making informed decisions.
Key characteristics of the Detail level include:
- Comprehensive Data: Detailed breakdown of specific data points.
- Actionable Insights: Data that informs decision-making.
- Contextual Understanding: In-depth view of problem areas.
Applying the MAD Framework as a Template for Success
The report development process becomes organized and efficient by starting with requirement gathering, educating stakeholders, and utilizing the MAD framework.This approach ensures that the final product not only meets the business’s needs but also provides valuable insights that drive informed decision-making. The combination of Monitor, Analyze, and Detail levels creates a comprehensive reporting structure that is both user-friendly and highly effective, while stakeholder education helps prevent scope creep and ensures the project stays within time and budget constraints.
By adopting these ideologies, businesses can establish a robust template for success, fostering a culture where data-driven decisions are paramount and organizational silos are significantly reduced.Top of Form